Tool pricing: per view, per user or % of revenue
Build, buy & decideOpinion6 min readMiniwall team
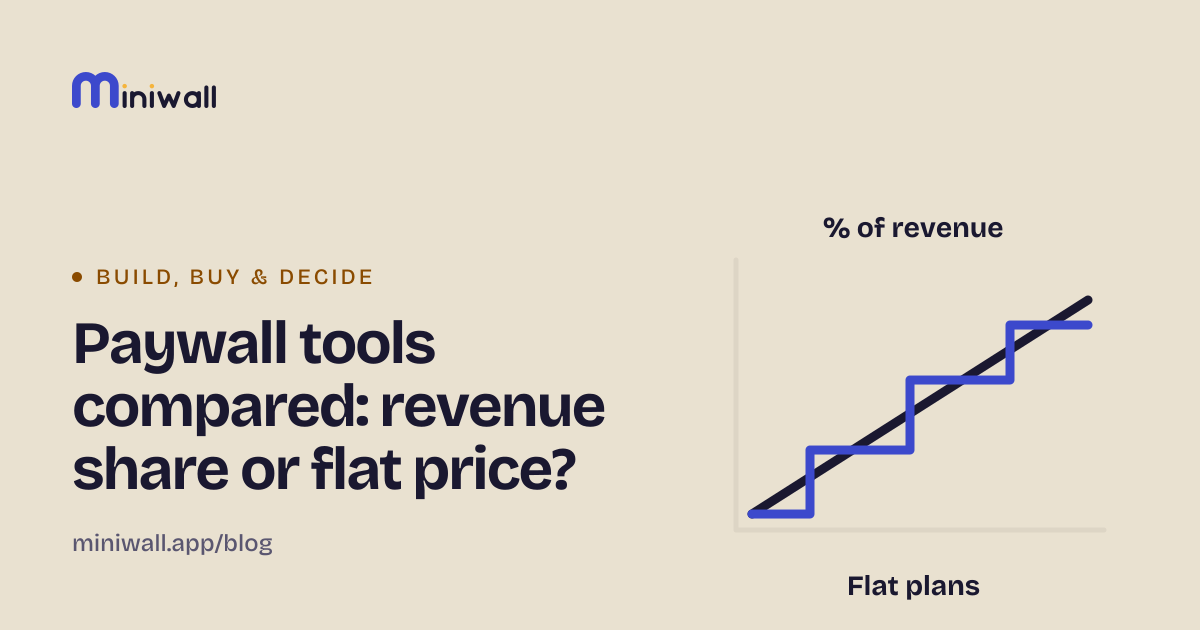
If your app has lots of free users and little revenue per person, the pricing model matters more than the price. Per active user hurts first, a share of revenue hurts last but never stops, and per view sits in between and follows your traffic, not your income. None of them is wrong. Each one is a bet on what grows fastest in your business.
Every number below is an example we made up, with unit prices that belong to nobody. The point is the shape of the bill, not the size. The arithmetic is simple enough to redo on a napkin, and we show it.
The three models, in one breath
- Per view (or event, or request). You pay for each time the tool does its job.
- Per active user. You pay for each person who touched your app in a month, whether or not the tool did anything for them.
- Share of revenue. You pay a percentage of the money the tool is credited with, or of everything you earn.
A price list can mix these with tiers, minimums and caps. We kept the three pure so you can see what each one rewards.
One app, three sizes
Imagine an app with these made-up unit prices, all "example":
- Per view: $0.40 per 1,000 views.
- Per active user: $0.01 per monthly active user.
- Share of revenue: 2%.
And a made-up app: subscriptions at $4 a month. Small, the app has 10,000 monthly users, 3% pay, and each person sees the tool's screen 3 times a month. At 100,000 users the ratios hold. At 1,000,000 users the audience is mostly free: only 1% pay, and each person sees 4 screens a month.
| Stage | Revenue | Per view | Per active user | 2% of revenue |
|---|---|---|---|---|
| 10,000 users, 300 paying | $1,200 | $12 (1.0%) | $100 (8.3%) | $24 (2.0%) |
| 100,000 users, 3,000 paying | $12,000 | $120 (1.0%) | $1,000 (8.3%) | $240 (2.0%) |
| 1,000,000 users, 10,000 paying | $40,000 | $1,600 (4.0%) | $10,000 (25.0%) | $800 (2.0%) |
Swipe sideways to see every column.
Percentages in brackets are the bill as a share of revenue. Read the last row. Revenue grew 3.3 times from the middle stage, users grew 10 times, and the per-user bill went from 8.3% of revenue to 25%. The revenue share never moved off 2%, because it can't. That's its whole promise.
The per-view bill moved from 1% to 4% because we also said each free user sees more screens. That's a fair assumption and an arbitrary one, so change it and see.
A spike
Now take the 100,000-user app and give it one very good month: a post goes around and 500,000 people show up. We'll say 200 of them subscribe, so 3,200 people pay $4, which is $12,800.
| Model | Normal month | Spike month | Change |
|---|---|---|---|
| Per view (1,500,000 views) | $120 | $600 | 5 times |
| Per active user | $1,000 | $5,000 | 5 times |
| 2% of revenue | $240 | $256 | +$16 |
Swipe sideways to see every column.
The first two follow the crowd, including crowds that never pay. The third barely notices, because the crowd brought almost no revenue. If you're a company that expects occasional bursts of free traffic, that's the best row of the table for revenue share.
Where each one hurts
Per active user is easy to forecast and easy to explain. It's also the model that charges you for people who gave you nothing, and "active" is a word you should make them define. We'd be most careful about it if you have a free tier that does well.
Share of revenue costs nothing while you earn nothing, which is a real gift early on. The catch is the other direction. Raise your price from $4 to $6 with the same 3,000 payers and revenue goes from $12,000 to $18,000. The bill goes from $240 to $360, up 50%, and the tool did no more work. You pay more for your own pricing decision. It also usually means the vendor needs to see your revenue, and it's the hardest model to walk away from once your numbers are large.
Per view is closest to the work done. A screen appears, you pay for it. It's also the model where a careless setting costs real money. Say the 1,000,000-user app puts a banner on every page and each person sees 20 screens a month. That's 20,000,000 views, which is $8,000 at our example rate, or 20% of revenue. The bill follows traffic, not income, so a busy free product can pay a lot for little revenue. You do control it, though: frequency limits and sensible triggers (we wrote about when to show an upgrade prompt) cut views, and nobody else's growth can raise it.
Our own view, and it's an opinion: pick the model whose meter you can influence. You can't make fewer people open your app. You can choose how often a screen appears.
Ask any vendor these
| Question | Why it matters |
|---|---|
| What exactly is one unit? | A view, an event, a user, a dollar: each has edge cases. Ask about previews, retries, bots and failed loads. |
| What happens when I go over? | Extra charge, a forced upgrade, or features switched off? Is anything shown to my customers affected? |
| Can I see usage before the invoice? | A meter you can read daily beats a surprise at month end. |
| What did the bill look like for a 5x month? | Ask them to run your spike through their formula. |
| Does the price change if I change my price? | This is the revenue-share question. |
| What do I get for nothing, and for how long? | A free tier that ends at the first real user is a trial. |
| What do I own if I leave? | Your data and your screens, and whether they export. |
| What notice do I get before prices change? | Ask for it in writing. |
Swipe sideways to see every column.
If a vendor can't answer the first two in a sentence each, take that as an answer.
When none of this applies
If the tool costs you $20 a month, you will spend more time analysing the model than the model will ever cost you. Pick the one with the clearest meter and move on. The shape starts to matter when the bill could become a line your finance person asks about.
Sources
- Miniwall docs, Plans and views (what counts as a view, what happens when views run out) (opens in a new tab)docs.miniwall.app · accessed